Tractography
Pathway explorer
Drag to rotate. Scroll to zoom.
Choose pathways, colors, and anatomy below.
Red: left–right · Green: anterior–posterior · Blue: superior–inferior
The outline follows the matching brain mask.
Loading pathways…
About these reconstructions
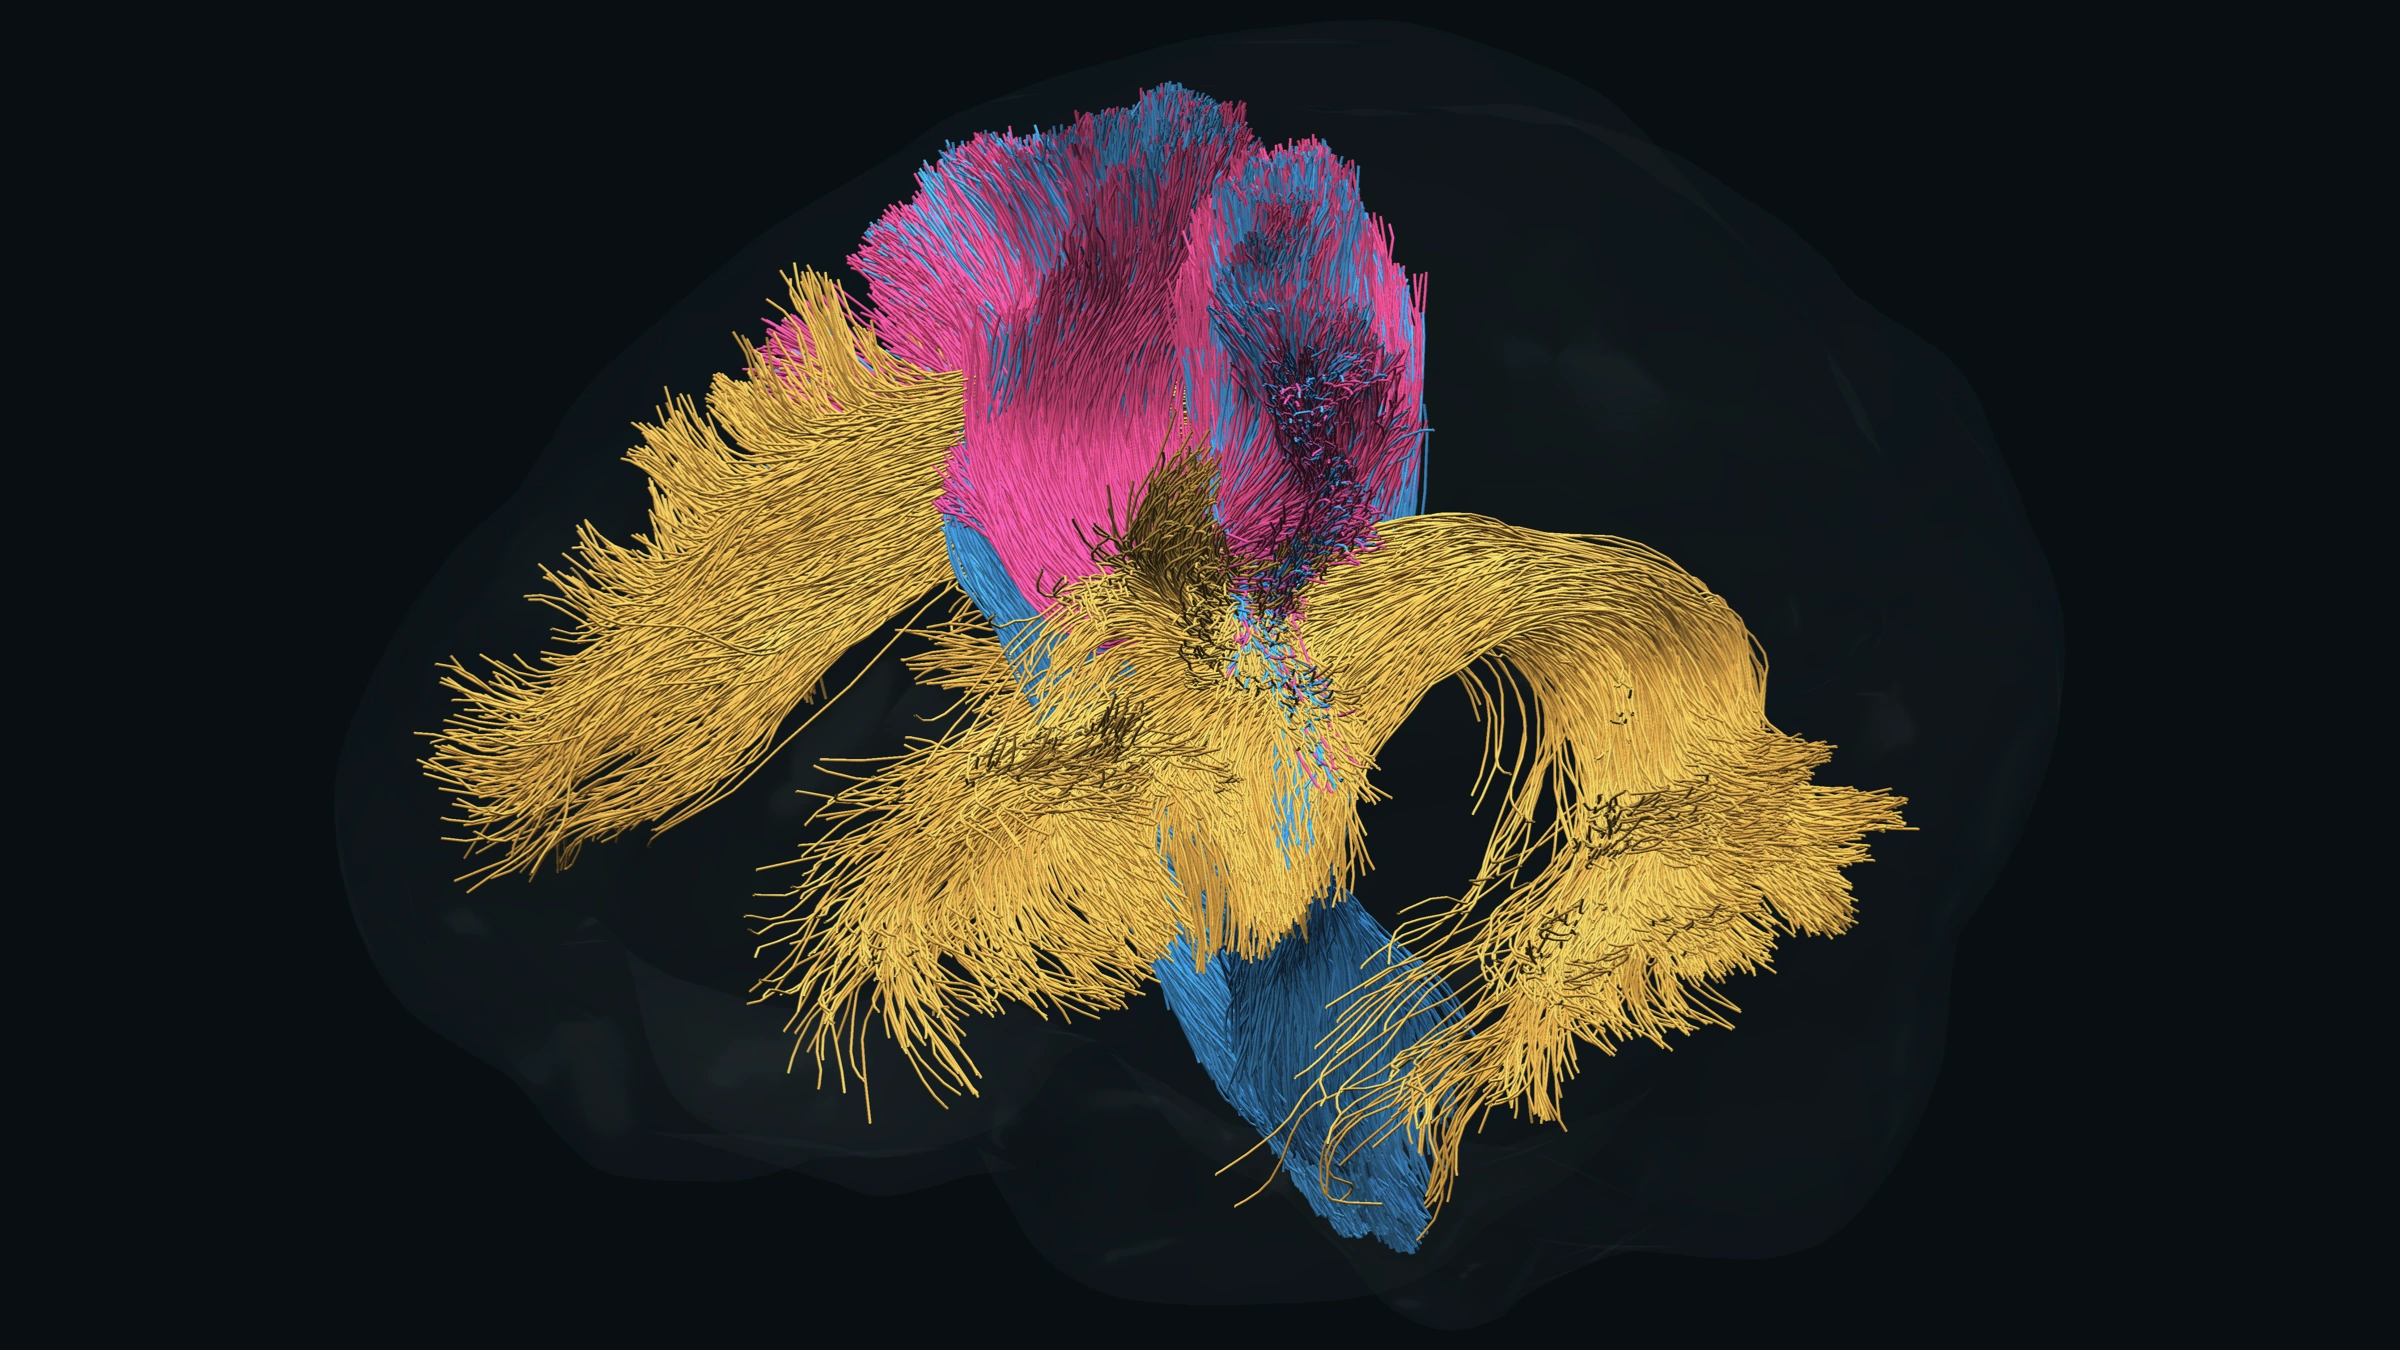
The viewer preserves every streamline and original point in 137 reconstructions from one diffusion MRI scan. The starting view shows the arcuate and corticospinal tracts and one callosal segment. Choose from the pathway list to add association fibers, individual callosal segments, projection pathways, and cerebellar peduncles. These are tractography trajectories, not individual axons.
Centroids describe the mean trajectory within each reconstruction after aligning streamline direction and sampling along its length. They summarize bundle shape; they are not additional measured fibers. In combined mode, centroids are overlaid in a contrasting color to keep their paths visible. The brain outline follows the matching diffusion-space brain mask, smoothed for display. Additional pathways were reconstructed with TractSeg and aligned to this same native space. Compressed files load only when selected. On phones, select a few pathways at a time for smoother rotation. The fornix reconstructions are partial and are labeled accordingly; tractography does not recover every anatomical connection.
BrainstemSeg adds 96 reconstructions across the brainstem and subcortical systems, with Tang variants in their own group. Names distinguish reconstruction variants and overlapping pathways. The input diffusion scan has 2.5-mm voxels; processing at a finer grid does not add measured resolution. Empty reconstructions are omitted, and reconstructions with fewer than 100 streamlines are marked sparse. Medial longitudinal fasciculus in BrainstemSeg is distinct from the middle longitudinal fasciculus listed under Association.
Choose Cortex in the Anatomy tab to display the matched FreeSurfer pial meshes, reconstructed from the 1-mm T1 scan and rigidly aligned to diffusion space. Every original surface vertex and triangle is retained. Gray matter regions displays the Desikan–Killiany parcellation; select a hemisphere or region to examine it. Glass, fine mesh, points, and solid views use this same cortical geometry.
Use 2D Sidebar to show linked T1 slices beside the pathways, or 2D Viewer to fill the display with all three slice planes. 3D Viewer returns to the 3D display. The T1 slices show brain-extracted anatomy from the same 1-mm T1 scan, resampled once onto a 1-mm grid in native diffusion space using the reviewed cortical registration. Axial, coronal, and sagittal views share a crosshair. Labels follow neurological convention (right is displayed on the right in axial and coronal views). Pathway overlays clip every selected streamline segment to the chosen 1–3 mm slab; a crossing appears as a short line or dot. Centroid mode shows centroid intersections. T1 intensity is windowed for display; alignment remains subject to diffusion resolution and EPI distortion.
Pathway colors are adjustable. Local orientation coloring uses red for left–right, green for anterior–posterior, and blue for superior–inferior. Colors do not measure tissue properties.