
2026 / bioRxiv / Preprint · not peer reviewed
Charting Cervical Spinal Cord Morphometry Across the Lifespan
Preprint · This work has not completed peer review.
Summary
This preprint develops cervical spinal cord reference charts using 78,269 scans from 41,042 individuals across 30 datasets. Measurements from C1 to C7 capture size and shape from birth to age 100. The charts reveal regional and sex differences and support age-adjusted comparison of individual cord measurements.
Study overview
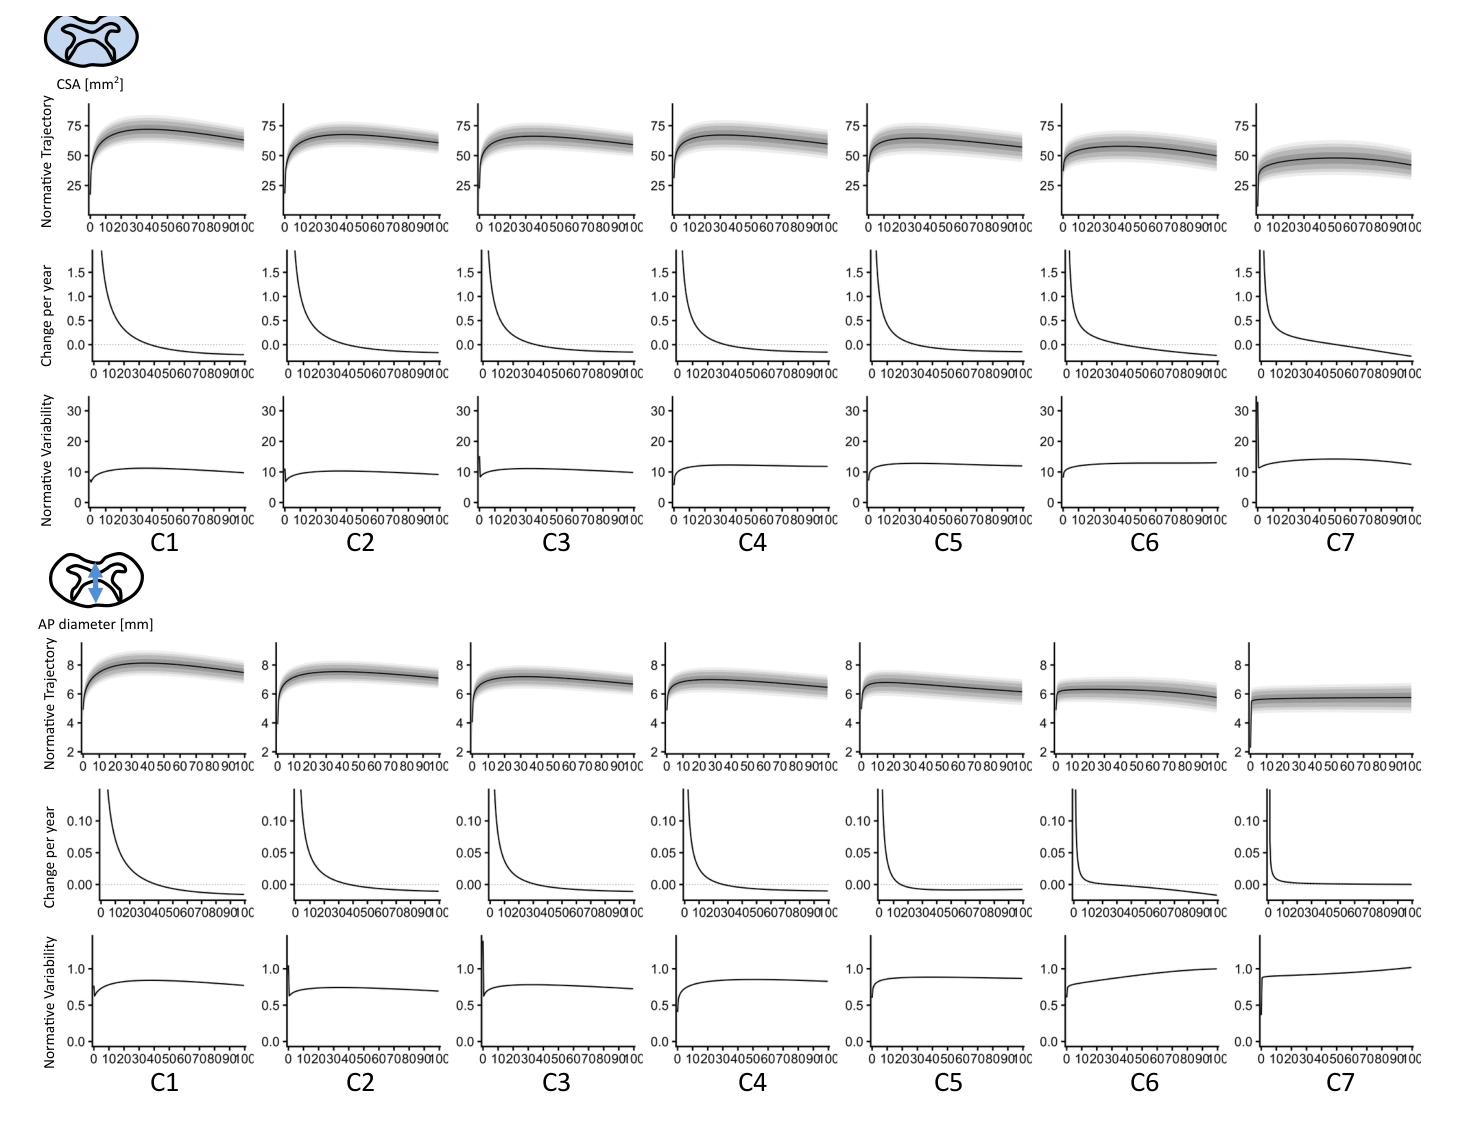
Normative reference data are needed to interpret spinal cord size and shape across the lifespan. This preprint combines brain MRI datasets with cervical coverage and applies contrast-agnostic segmentation to 78,269 scans from 41,042 individuals aged 0–100. Measurements include cross-sectional area, diameters, and shape indices across C1–C7. The resulting models show rapid growth in childhood and adolescence, maturation in early-to-mid adulthood, and later decline, with regional and sex-related differences. Cord trajectories also show temporal relationships with brain white matter and brainstem volumes. The released framework is designed for age- and sex-specific centile scoring, with further validation needed beyond this preprint report.
Main findings
- Uses 30 datasets and 41,042 individuals spanning ages 0–100.
- Models size and shape at cervical levels C1–C7.
- Cross-sectional area typically peaks in the mid-30s before decreasing.
Cite this work
Kurt G. Schilling et al. · Last author: Bennett A. Landman (2026). Charting Cervical Spinal Cord Morphometry Across the Lifespan. bioRxiv. https://doi.org/10.64898/2026.06.03.729823
This page summarizes the work; consult the original article for the complete methods, results, and qualifications.