
2026 / Nature / Article
White matter micro- and macrostructure brain charts for the human lifespan
Summary
White matter growth charts built from 35,120 brain scans provide reference trajectories from birth to 100 years. The study measures tissue properties and pathway shape across 72 tracts, enabling age- and sex-adjusted comparisons. Public models, processing tools, and shareable derived data support independent use of the charts.
Study overview
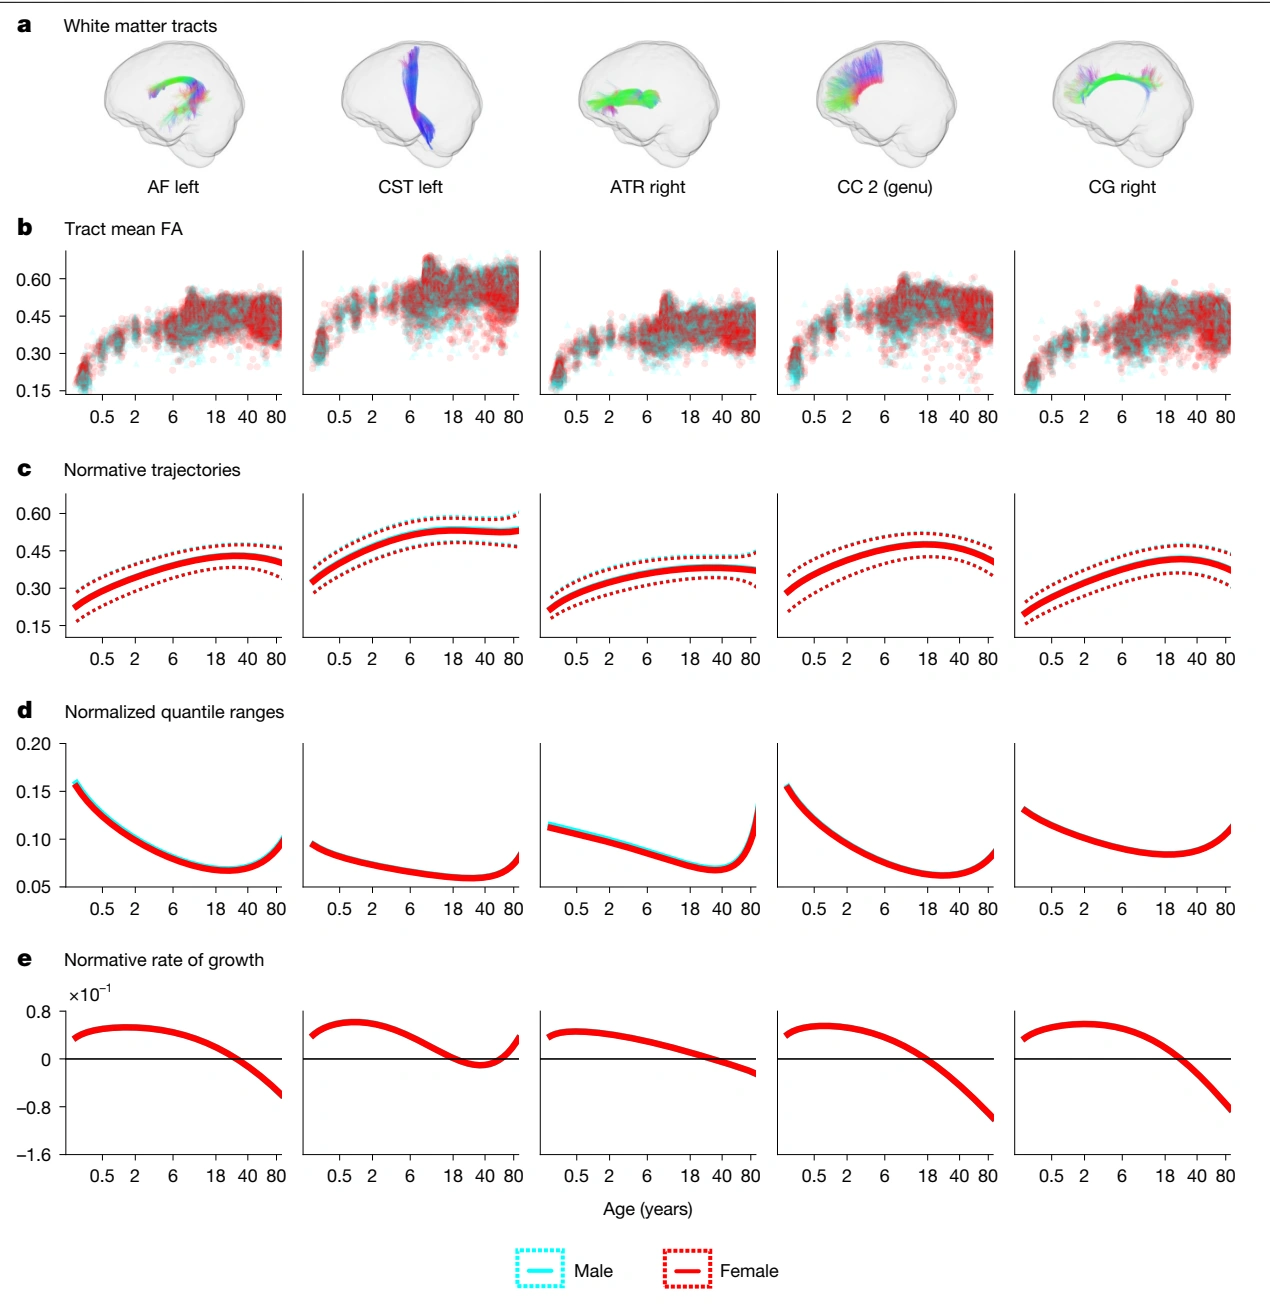
This Nature study establishes lifespan reference charts for white matter using 35,120 scans from 50 studies. It models microstructural diffusion measures and macrostructural pathway geometry across 72 tracts, describing typical values, variability, and developmental milestones from birth through age 100. The charts show that maturation and aging follow different schedules across pathways and measurements. Individual centile scores quantify departures from age- and sex-specific reference distributions, and analyses demonstrate differences in selected clinical groups. Public models support scoring new research datasets, with companion processing tools and a release of derived data permitted by the contributing studies. These cross-sectional references provide a foundation for further research and clinical validation.
Main findings
- Normative charts span birth to age 100 using 35,120 scans from 50 studies.
- Microstructural and macrostructural trajectories differ across 72 white matter pathways.
- Centile scores enable individual measurements to be compared with reference distributions.
- Open models, processing instructions, and permitted derived datasets accompany the study.
Interpretation
The charts describe reference distributions for research. They are not, by themselves, a diagnostic test. The public data release contains permitted derived measurements from 20 of the 50 source datasets, rather than all raw MRI scans.
Data, models, and software
Brain chart models and scoring
Version 0.2.1: lifespan models, centile curves, new-dataset alignment, and power-analysis code.
Derived data
Permitted derived features and centile scores from 20 of 50 source datasets; no raw images or diagnostic information.
Postprocessing pipeline
Instructions and examples for the container that measures 72 tracts and prepares brain-chart features.
Processing container
Docker image linked by the published article and verified Zenodo processing record.
Publisher correction, 2026-06-02: Figure 3a label corrected to White matter tracts.
Cite this work
Michael E. Kim et al. · Last author: Kurt G. Schilling (2026). White matter micro- and macrostructure brain charts for the human lifespan. Nature. https://doi.org/10.1038/s41586-026-10454-2
This page summarizes the work; consult the original article for the complete methods, results, and qualifications.